TL;DR: General A/B test averages can hide real wins. In two GoodKarma client tests — Anna+Nina's Shop the Look redesign and Daily Paper's Smart Cart drawer — the overall result looked weak or mixed, but segmenting by mobile/desktop and new/returning visitors revealed clear winners. The takeaway: always segment your analysis before calling a test; look for directional consistency across metrics; and roll out partial wins instead of killing them based on a misleading average.
The fix is not running test after test. It's a habit. And across two clients — Daily Paper and Anna+Nina — that habit revealed strong wins hiding beneath mediocre averages.
Why this is a problem right now
Tools like Rollout are making A/B testing accessible to all Shopify brands. For content testing — copy, imagery, headlines — it's a great starting point. Fast to set up, easy to read, no technical overhead. But once you start testing interactions — cart drawers, sticky ATCs, click-through logic — a blended result can hide more than it reveals.
Two customers. Same test. Completely different experience:
Persona A — First-time visitor, came via paid social. Needs to run through the funnel without questions.
Persona B — Returning customer, direct traffic. Knows the brand, knows their size, came back for a specific drop. Wants to check out in under 90 seconds.
Your traffic is always a mix of both. The blended result tells you what happened on average. It doesn't tell you who you're helping and who you're hurting.
Two tests. Two segmented wins.
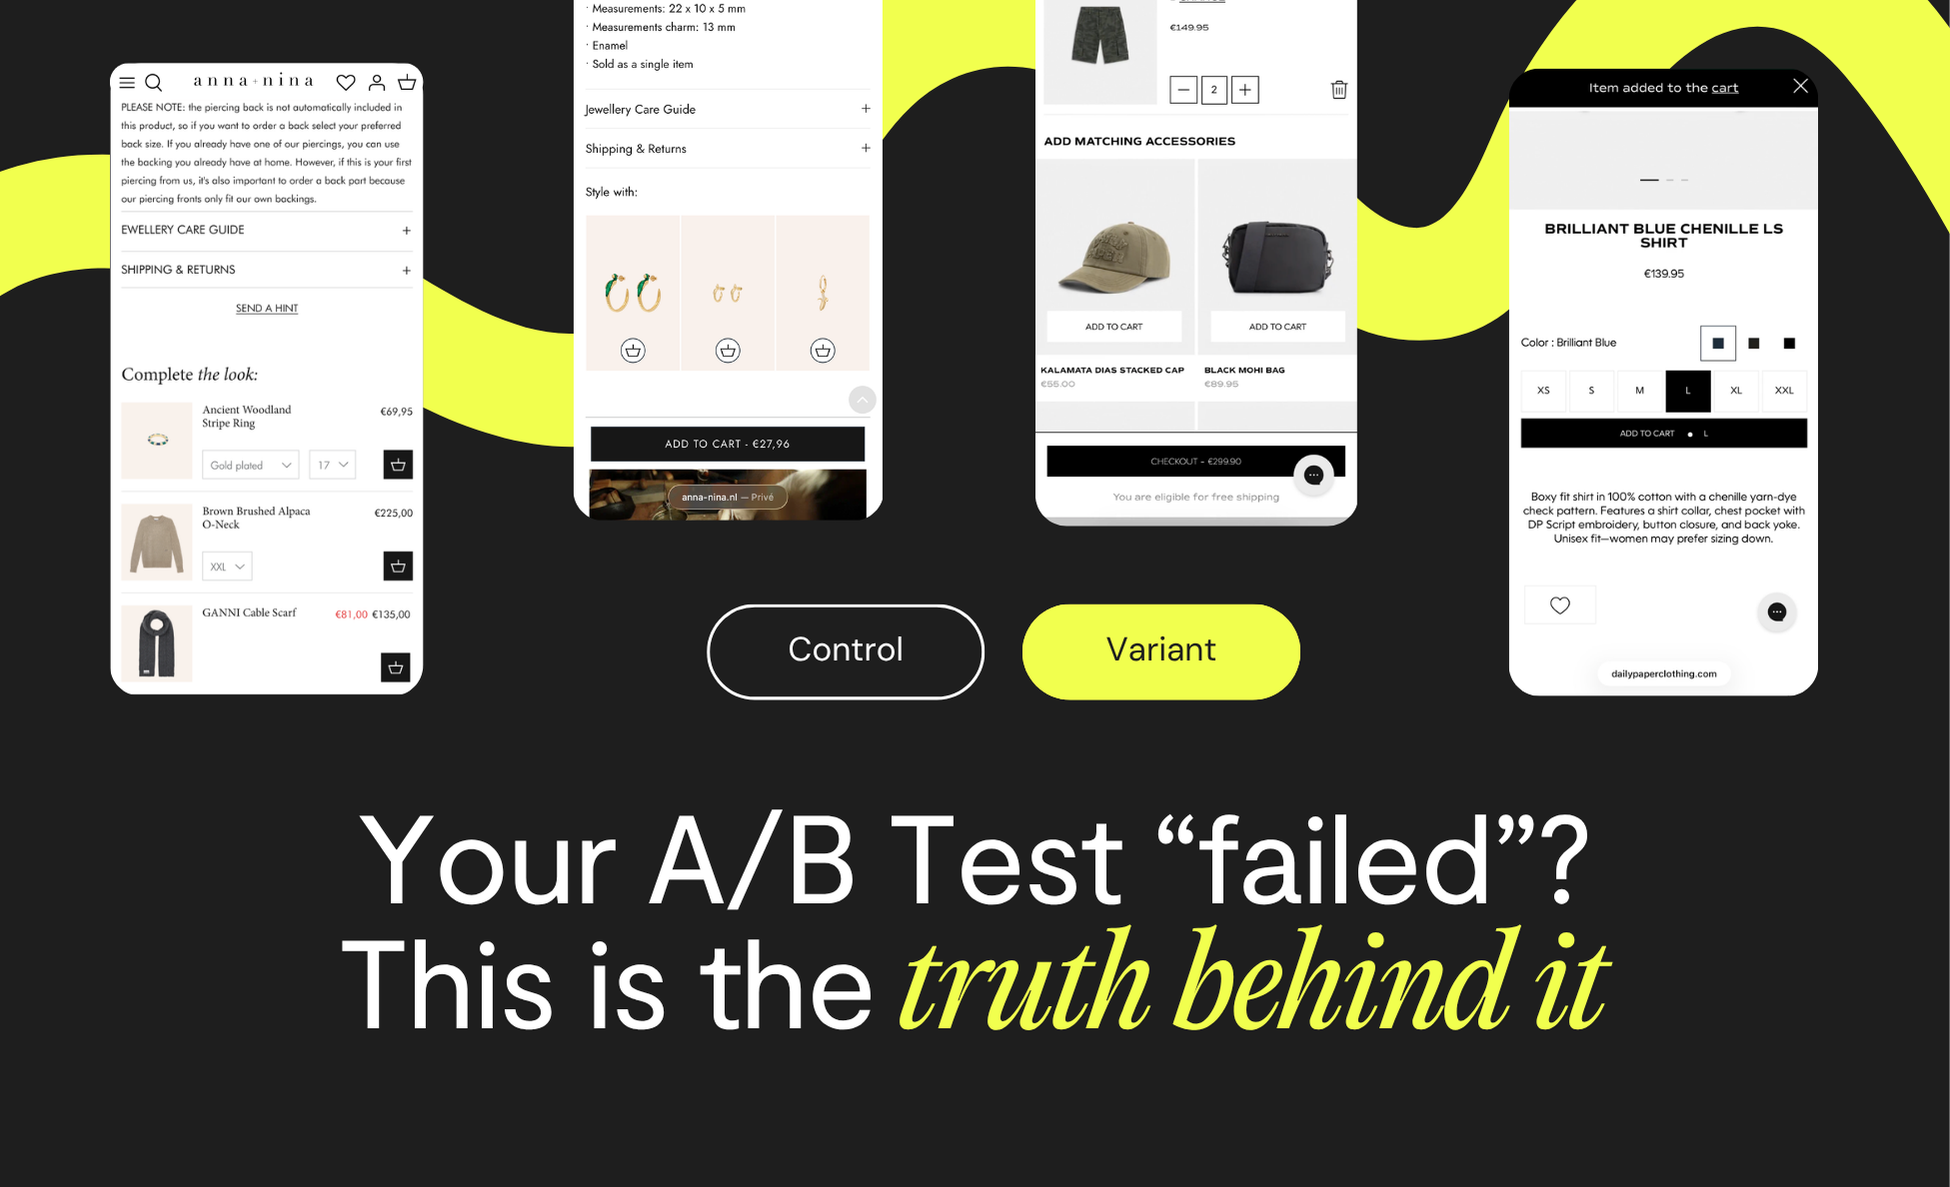
Anna+Nina — PDP Shop the Look redesign
.png)
Hypothesis: IF we implement a more interactive, visually modern "Shop the Look" widget THEN we will increase Engagement and Conversion Rate.
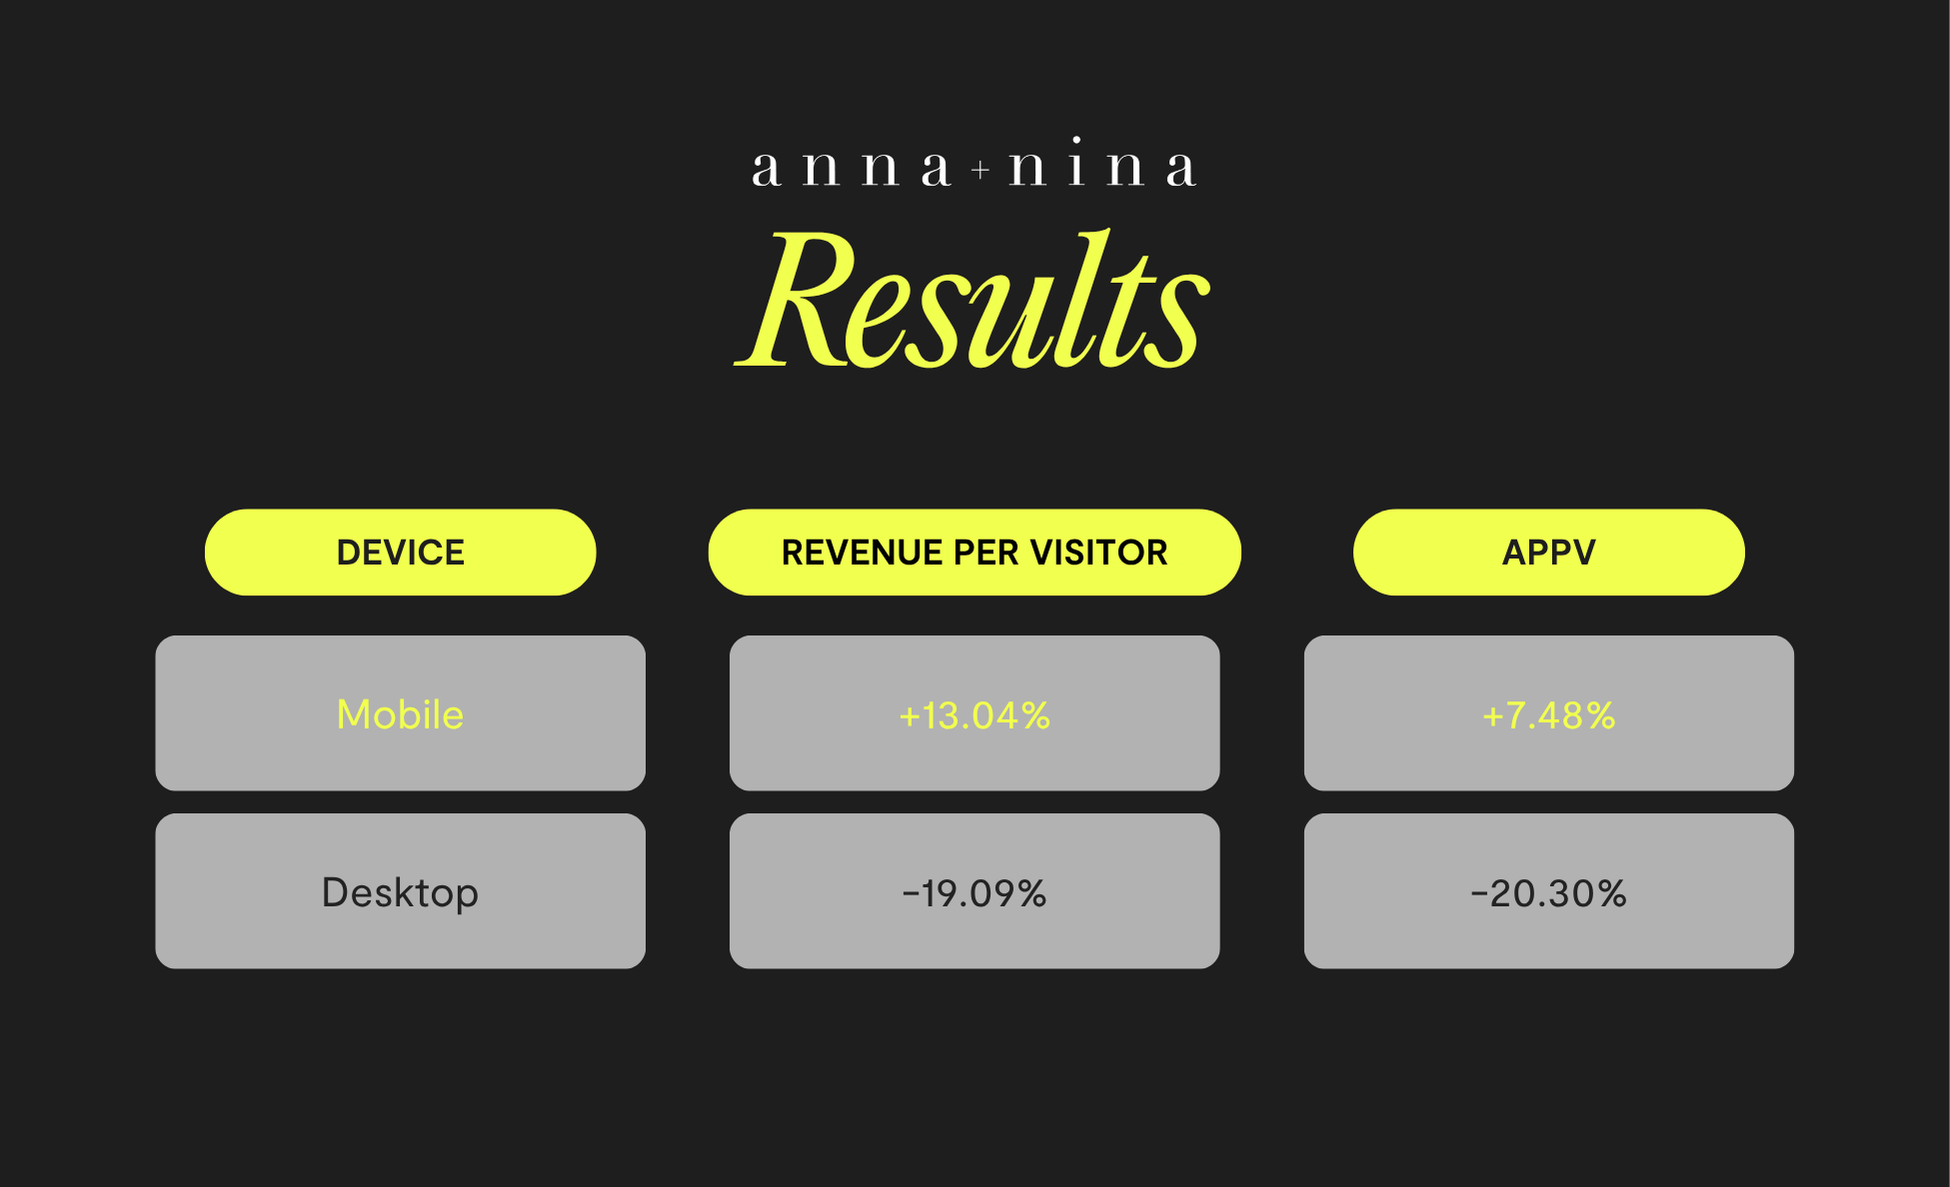
Mobile users navigated the redesign with high intent — it worked. On desktop, the added interactivity pulled users sideways across the PDP rather than forward through the funnel. Decision: roll out to mobile only.
Daily Paper — Smart Cart drawer on Add-to-Cart
Hypothesis: If we implement a "Smart Cart" drawer that slides out on "Add to Cart," then we will increase the cart-to-checkout rate.
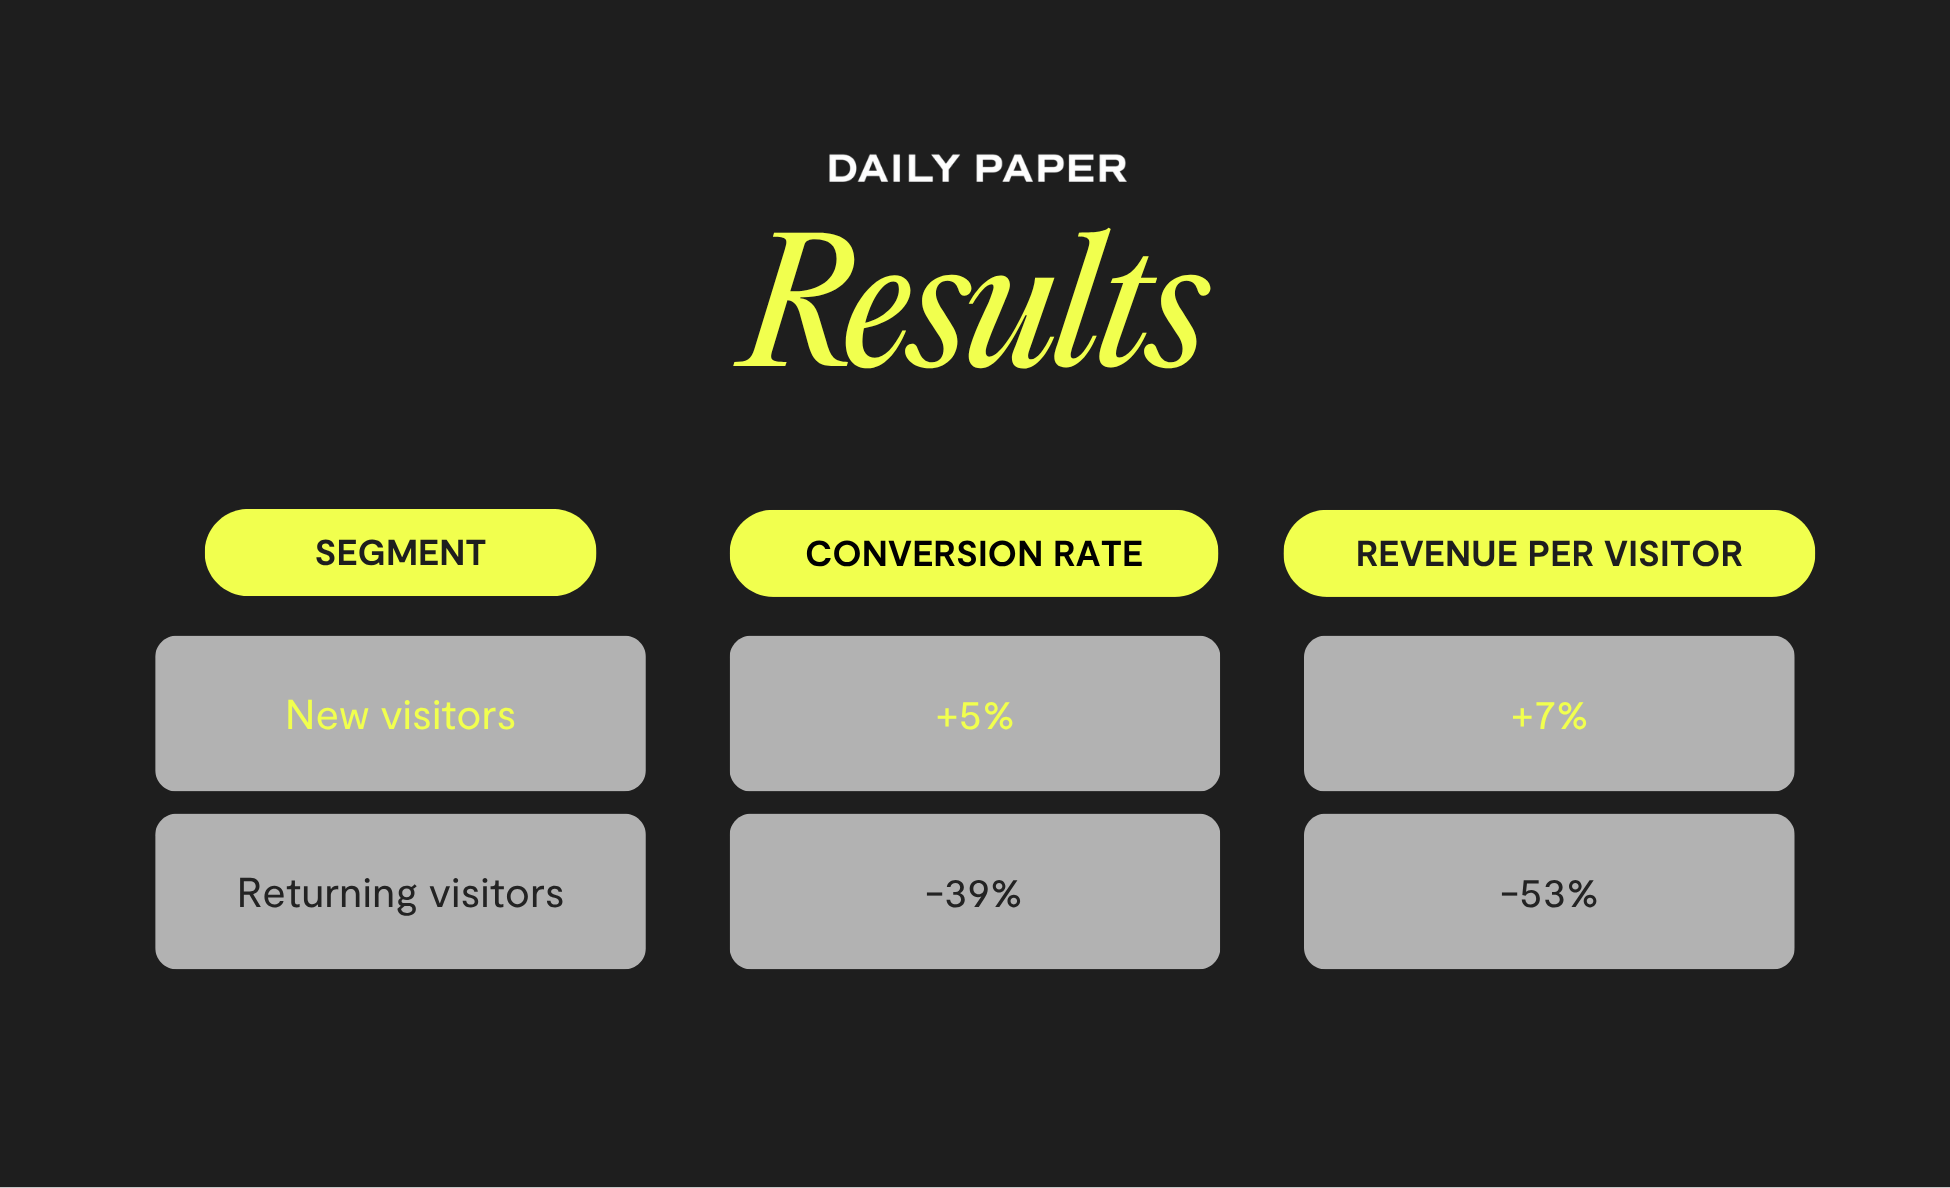
The drawer helped new visitors who needed a nudge and visual confirmation. For returning customers, it added unnecessary friction. Decision: roll out to new customers only.
The pattern across both tests is the same: the average lied. The segment told the truth.
New vs returning and mobile vs desktop are the minimum cuts worth making before you call any test. Run them consistently, and you stop killing winners that were hiding inside losing averages.
- Segment every test before you call it. New vs returning and mobile vs desktop are the minimum.
- Look for directional consistency. If RPV, purchase rate, and checkout started all move the same way for a segment, act on it — even below 95% confidence.
- Match your rollout to your findings. Most A/B tools support targeting by device or customer tag. A partial rollout of a segmented winner beats a full rollout of a blended result.
- Let the findings brief your next test. If the cart drawer helped new visitors but hurt returning ones, your next question writes itself.
If your results look flat, the segment is probably telling a different story. Want to know how we implemented the segmented outcomes across these stores? Talk to us.

.png)